
Key stage 2 comparative report
| Subject | Percentage of pupils achieving the expected standard: school | Percentage of pupils achieving the expected standard: nationally (1) | Average scaled score: school (2) | Average scaled score: nationally (3) |
| English reading | 76% | 74% | 104 | 105 |
| English grammar, punctuation and spelling | 79% | 72% | 106 | 105 |
| Mathematics | 78% | 71% | 104 | 104 |
| English writing (teacher assessment) | 67% | 69% | N/A | N/A |
| Science (teacher assessment) | N/A | N/A |
Percentage of Pupils achieving a higher standard in reading, writing and maths combined for 2021 - 2022 was 5% and 10% Nationally.
Reading: 27% National 28%
Maths: 32% National 22%
Writing: 14% National 13%
Reading, Writing and Maths Combined: 59% National 59%
(1) Percentages for English reading, English grammar, punctuation and spelling, mathematics, and English writing teacher assessment (TA) are based on provisional headline information on the 2022 national curriculum assessments: Tests and assessments (key stage 2) - GOV.UK (www.gov.uk)
(2) Scaled scores guidance: www.gov.uk/guidance/scaled-scores-at-key-stage-2
(3) Average scaled scores for English reading, English grammar, punctuation and spelling and mathematics are based on provisional headline information on the 2019 national curriculum assessments: Tests and assessments (key stage 2) - GOV.UK (www.gov.uk)
-
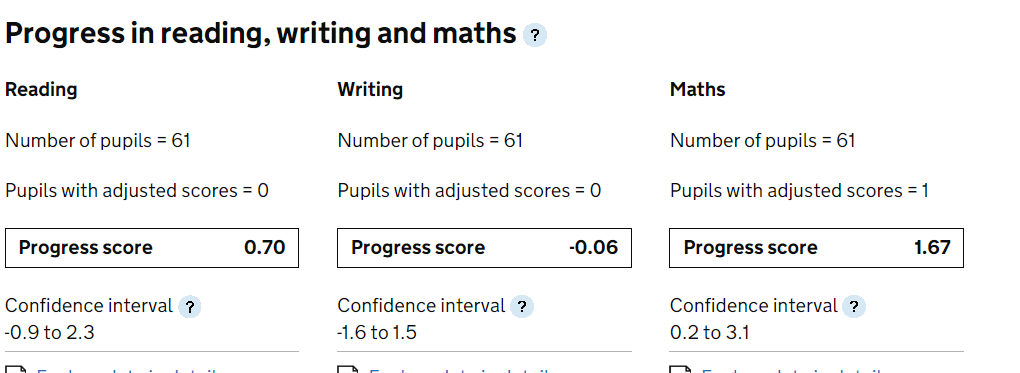
Progress in reading, writing and maths
Key stage 1 comparative report
This information allows you to compare your child’s performance at the end of key stage 1 with the attainment of other year 2 pupils in our school this year, and across England.
| Subject | Percentage of pupils achieving the expected standard: school (2019) | Percentage of pupils achieving the expected standard: nationally |
| English reading Y2 | 69% | 67% |
| English writing Y2 | 61% | 58% |
| Mathematics Y2 | 69% | 68% |
| Phonics Y1 | 78% | 75% |
(1) Data showing the attainment of pupils in the 2022 key stage 1 national curriculum teacher assessments: Phonics screening check and key stage 1 assessments: England 2022 - GOV.UK (www.gov.uk)
| Percentage of pupils achieving the expected standard: school | Percentage of pupils achieving the expected standard: nationally | |
| Good level of development | 73% | 65% |